Scrip
Recommendation GHCL Buy
CMP 300(Rs.)
Entry Level 290-270(Rs.)
Stop Loss 225(Rs.) weekly closin basis
Partial Profit Level 355(Rs.)
Final Target Price 410(Rs.)
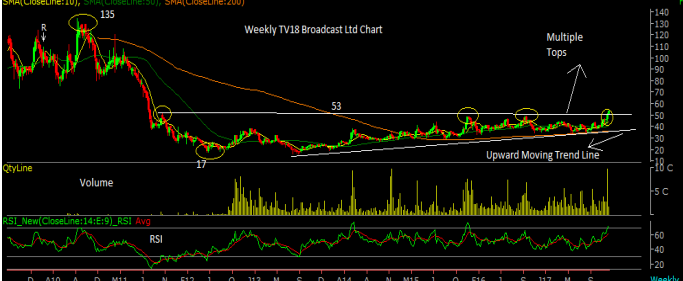
In the above weekly chart of GHCL Ltd we can see that stock has moved upside from 24 in March 2014 to 101 in Sept 2014. We have seen almost 77 points rally in period of 6 months before retracing almost 62 percent of upward rally to make lows around 51.50 in Mar 15. Volumes were quiet higher in upward rally as compare to downside rally. From Mar 15 to Dec 15 stock gave upwardly rally of 95 points making high of 146.
From Dec 15 to Fed 16 stock corrected almost 50 percent of previous rally to make multiple bottoms around 91. Fed 16 to Oct 16 we saw stock to surge 202 points to make all time high of 293. In Current period of Oct 16 to Nov 17 stock consolidated in range of 90 points making Flag pattern taking multiple supports at 201 and then gave breakout on higher side at 270. Stock has given upside rally in previous week breaching multiple resistances of 266 and making high of 280. Volume was marginally high in current weeks as compare to previous weeks. RSI is also moving upside and moving above reference line (White Line) is a good signal for upside rally. It has also taken strong support of 10WMA of 246 which is a good signal for upside.
Favored View: From the above analysis we suggest to BUY GHCL at dips of 290 and more at 270, stop loss will be at a weekly close below 225, we suggest to book partial profits at 355 and rest we will hold till our target of 410, this gives us a good Risk/reward ratio of around 1:2 and upside of around 41% ideally we could see this upside in 6 months to 12 months period.
WHAT EVER YOU EARN FROM MY CALLS PLEASE GIVE 10% PROFIT'S FOOD TO COWS AND DOGS HELP THM GOD WILL HELP YOU-!!!
CMP 300(Rs.)
Entry Level 290-270(Rs.)
Stop Loss 225(Rs.) weekly closin basis
Partial Profit Level 355(Rs.)
Final Target Price 410(Rs.)
In the above weekly chart of GHCL Ltd we can see that stock has moved upside from 24 in March 2014 to 101 in Sept 2014. We have seen almost 77 points rally in period of 6 months before retracing almost 62 percent of upward rally to make lows around 51.50 in Mar 15. Volumes were quiet higher in upward rally as compare to downside rally. From Mar 15 to Dec 15 stock gave upwardly rally of 95 points making high of 146.
From Dec 15 to Fed 16 stock corrected almost 50 percent of previous rally to make multiple bottoms around 91. Fed 16 to Oct 16 we saw stock to surge 202 points to make all time high of 293. In Current period of Oct 16 to Nov 17 stock consolidated in range of 90 points making Flag pattern taking multiple supports at 201 and then gave breakout on higher side at 270. Stock has given upside rally in previous week breaching multiple resistances of 266 and making high of 280. Volume was marginally high in current weeks as compare to previous weeks. RSI is also moving upside and moving above reference line (White Line) is a good signal for upside rally. It has also taken strong support of 10WMA of 246 which is a good signal for upside.
Favored View: From the above analysis we suggest to BUY GHCL at dips of 290 and more at 270, stop loss will be at a weekly close below 225, we suggest to book partial profits at 355 and rest we will hold till our target of 410, this gives us a good Risk/reward ratio of around 1:2 and upside of around 41% ideally we could see this upside in 6 months to 12 months period.
WHAT EVER YOU EARN FROM MY CALLS PLEASE GIVE 10% PROFIT'S FOOD TO COWS AND DOGS HELP THM GOD WILL HELP YOU-!!!