Wednesday 30 April 2014

NeoWave Analysis of Nifty cash Daily wave chart Date : 29th April, 2014


Conclusion: 

1. Currently, the second correction of anticipated “Double Combination” pattern may be unfolding. 

2. The second correction may be Contracting Triangle (with reverse alteration) or Diametric. 

3. The 6875 level is crucial resistance and the index action around it may bring clarity about 
Contracting Triangle or Diametric. If Nifty cash fails to cross above 6875 then Contracting 
Triangle is unfolding and upward wave E is pending which may rise up till 6870-6875 area. On 
the other hand if 6875 gets breached then Diametric is unfolding and in this case waves E, F and 
G are pending. In this case, the index may rise up till 6970 and has the capacity to rise till 7060. 

4. The wave A of second corrective is of trending nature whereas waves B, C and D are of sideways 
nature. The sideways action has breached above the top of wave A. This is the indication of high 
strength of trend. This price action indicates the high probability of index moving up till 6970 and 
above. 

5. But kindly note, the breach of 6665 on or before 2nd May 2014 will negate the above anticipation. 
Hence one can initiate long in the area of 6705-6680 (if some sort of reversal pattern is formed on 
short tern charts) with stop loss of 6660 for minimum target of 6870 and further up till 6970. 


WHAT EVER YOU EARN FROM MY CALLS PLEASE GIVE 10% PROFIT'S FOOD TO COWS AND DOGS HELP THM GOD WILL HELP YOU-!!!

Monday 28 April 2014

NeoWave Analysis of Nifty cash  Weekly wave chart    Date : 28th April, 2014


Conclusion: 
1. In Diametric pattern, generally wave (g) equals wave (a) in price. Kindly note, this is just a 
guideline and not rule and hence may not be followed. As per this guideline, the maximum upside 
that may take place is till 7180. 
2. If Diametric or Double Combination pattern is taking place inside wave (g) then the Nifty cash 
should not fall below 6770 and should move upwards towards 7000 levels during next 1-2 weeks. 
The Diametric pattern (that started from 5118.85) may get completed between 5th and 16th May 
2014. 
3. In case, if Nifty cash falls below 6665 during next week then wave (g) is complete and expected 
upper side will get negated. 
4. The important levels to watch during next week are 6665 and 7000. 
Chart notes: 
1. The 1st rectangle measures price vertically. 
2. The 2nd rectangle measures time horizontally. 
3. The 3rd rectangle is equal to 1st vertically and to 2nd horizontally. 

WHAT EVER YOU EARN FROM MY CALLS PLEASE GIVE 10% PROFIT'S FOOD TO COWS AND DOGS HELP THM GOD WILL HELP YOU-!!!

 Daily wave chart Date : 28th April, 2014


Conclusion: 
1. The presence of too many possibilities indicates that the pattern is away from completion and 
more data points will be needed to identify the end of pattern. 
2. The Nifty cash may remain moving between 6740 and 6875 for next 3-4 days. 
3. The level of 6875 needs to be breached for Nifty cash to move up but if it falls below 6665 
on/before 1st May 2014 then the pattern has completed. 
4. The important levels to watch during next 3-4 days are 6875, 6740 and 6665. 
5. The probability of moving down will increase if 6740 is breached and moving up will increase if 
6875 is breached. 
Chart notes: 
1. The 1st rectangle measures price vertically and time horizontally. 
2. The 2nd rectangle also measures price vertically and time horizontally. 
3. The horizontal line between the 2nd rectangle is 61.8% level of price

WHAT EVER YOU EARN FROM MY CALLS PLEASE GIVE 10% PROFIT'S FOOD TO COWS AND DOGS HELP THM GOD WILL HELP YOU-!!!

Monday 21 April 2014

Weekly roadmap for Nifty cash Date :21/04/2014

Analysis : Anticipation for next 1-2 weeks.


Weekly wave chart updated till 17/04/2014


1.      The wave (g) of a Diametric pattern (which started from 5118.85) is in progress.

2.      The clarity about pattern inside wave (g) is less. It may be Complex corrective pattern (Zigzag –X- some corrective pattern) OR Diametric.

3.      The 6845-6855 area on Nifty cash is crucial resistance area. If Complex corrective pattern is unfolding inside wave (g) then index should not move above 6855.

4.      In case, if Nifty cash crosses above 6855 then Complex corrective pattern is negated and Double Zigzag becomes the possibility. In this case, the index may make top somewhere below 7180.

5.      The uptrend in Nifty cash is intact till 6650 is not breached and has the capacity to move up till 7180. If 6650 is breached then it is the indication that uptrend is over.


Daily wave chart updated till 17/04/2014


1.      The Diametric seems to be completed in the above daily wave chart.

2.      The wave G seems to be forming Flat pattern and currently wave c of expected Flat pattern is unfolding.

3.      If the above anticipation of Diametric pattern is correct then Nifty cash should not move above 6806 level and should fall towards 6460 but, kindly note that the anticipated pattern will be confirmed on breach below 6665.

4.      The wave c of the Flat may get subdivided and may unfold as Terminal Impulse.
In this case, the index may remain between the range of 6806 and 6720 till 23rd April 2014.

5.      In case, if Nifty cash moves above 6806 then the probability of it moving above 6820 and reaching higher levels will increase and hence, the anticipated pattern of Diametric will get negated.

-nitin sir

WHAT EVER YOU EARN FROM MY CALLS PLEASE GIVE 10% PROFIT'S FOOD TO COWS AND DOGS HELP THM GOD WILL HELP YOU-!!!

Tuesday 15 April 2014

PAIR STRETEGY FOR NIFTY CALL PUT TILL EXPIRY~~~!!!

BUY NIFTY 6550 PUT AT 7RS
&
BUY NIFTY 6950 CALL AT 6 RS

TOTAL 7+6=13 TOTAL PAID

TGT DBBL TRRPL TILL EXPIRY

WHAT EVER YOU EARN FROM MY CALLS PLEASE GIVE 10% PROFIT'S FOOD TO COWS AND DOGS HELP THM GOD WILL HELP YOU-!!!

Weekly roadmap for Nifty cash Date :13/04/2014 (nitin sir)

Analysis : Anticipation for next 2-3 weeks.


Weekly wave chart updated till 11/04/2014


1.  The wave (g) of a Diametric pattern (which started from 5118.85) is in progress.

2.  The clarity about pattern inside wave (g) is less. It may be Complex corrective pattern (Zigzag –X- some corrective pattern) OR Diametric.

3.  The 6845-6855 area on Nifty cash is crucial resistance area. If Complex corrective pattern is unfolding inside wave (g) then index should not move above 6855.

4.  In case, if Nifty cash crosses above 6855 then Complex corrective pattern is negated and Double Zigzag becomes the possibility. In this case, the index may make top somewhere below 7180.

5.  The uptrend in Nifty cash is intact till 6650 is not breached.

Weekly roadmap for Nifty cash

Conclusion

1.  The important levels to watch during next week are 6650 and 6855.

2.  The breach below 6650 will indicate that the top is in place (whatever new top that is made below 6855).

3.  The decisive breach above 6855 may push Nifty cash towards 7180 levels.


WHAT EVER YOU EARN FROM MY CALLS PLEASE GIVE 10% PROFIT'S FOOD TO COWS AND DOGS HELP THM GOD WILL HELP YOU-!!!

Thursday 10 April 2014

Do u feel u missed the rally??? Just take your decision after going through the below mentioned statistics which have taken place pre and post Election .

Do u feel u missed the rally???  Just take your decision after going through the below mentioned statistics which have taken place pre and post Election .

Pre- Election: Sensex is likely to be in the range of 23,400-23,500 in the short term.
From 1989-2009 Sensex has delivered an average 14.8% returns in 6 months before the elections and hence assuming that the average will be maintained we believe rally is likely to continue and be in the range of 23,400-23,500 in the short term.

Post- Election: Sensex to make new highs after elections and deliver superior returns in the range of 40-50%.
From 1989-2009 Sensex has delivered an average of 70-80% returns during the election year. Considering the higher base and hurdles the new government might have face and hence assuming that Sensex will be able to deliver 40-50% returns, post the election event, the Sensex will be in a new orbit of 30,000-32,000 levels in the medium to long term.
Don’t worry, Markets are not going to fizzle out soon….. Focus on cyclical  like Banking, Capital Goods, Infra, Transmission and Distribution, Media and Oil and Gas.
 
We recommend investors to Buy Oberoi Realty, Tata Motors Limited, Crompton, Siemens, ABB, GMR Infra, Indiabulls Real Estate, South Indian Bank andMunjal Showa from short to medium term perspective.


Monday 7 April 2014

Weekly roadmap for Nifty cash--nitin sir

Weekly roadmap for Nifty cash

Analysis : Anticipation for next 2-3 months.


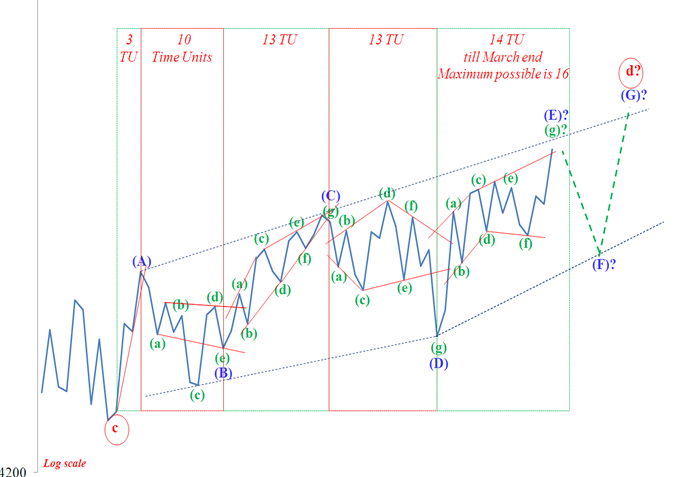
Monthly wave chart updated till 31/03/2014


1.      The pattern anticipated from the end of wave circled c (red) is Diametric and currently, wave (E) is unfolding.

2.      The wave (E) is again unfolding as Diametric and currently wave (g) inside (E) is in progress.

3.      The above mentioned wave (g) already reached its given minimum target of 6420 and has crossed above maximum target of 6620 and hence the scale is changed from linear to logarithmic.

4.      Since the Nifty cash is in last leg of wave (E), the completion of Diametric inside wave (E) may open index for downward move as wave (F) which may fall till


minimum  of  5930  and  maximum  of  5700.  The  target  area  of  5930-5700  is expected to reach before end of June 2014.

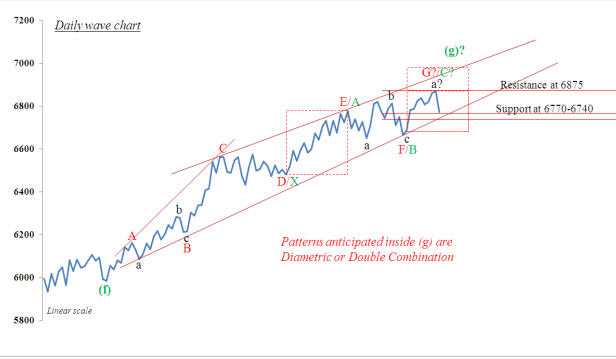
5.      To profit from the expected fall, we must anticipate the end of wave (E). To anticipate end of wave (g), we need to know the maximum level till which Nifty cash can move up and the important resistances levels (which can act as turning points) below maximum level. The maximum upside for wave (g) is till 7150. Kindly note, it is not necessary for wave (g) to touch 7150 level; it is just the maximum level till which Nifty cash can move up. The maximum levels are touched only in extreme conditions and never in general conditions. Please also note that the coming Elections can generate extreme conditions.

6.      The 6778 level seems to be important and crucial resistance level and can act as a turning point. Till date, the index has made the high of 6776.75 and is currently hesitating to move up.

7.      Since the confirmation of completion of pattern comes late on bigger time frame charts, we need to analyze weekly wave chart to get the evidence of pattern completion.


Analysis : Anticipation for next 3-4 weeks.

Weekly wave chart updated till 04/04/2014

1.      The wave (g) has consumed 17 time units till 4th April 2014 and seems to be around completion.
2.      The completion of wave (g) will also complete wave (E) and may open Nifty cash for down move which may fall till 5930 on or before 6th June 2014.
3.      The confirmation of completion of wave G will come if 6660 is breached on or before 11th April 2014. Thereafter Nifty cash needs to cross below 6470 on or before 18th April 2014 to confirm the completion of wave (g).
4.      In case, if Nifty cash crosses above 6778 (without moving below 6660) then the index is heading for higher levels. In this case, the counts on weekly wave chart may change in future.

Note : The clarity on daily chart is very low and hence is not presented in this report. But the cross below 6675 on 8th April 2014 will increase the probability of reversal. If 6675 is crossed on 8th April then we need to watch 6660.
 Conclusion
For confirmation of reversal and pattern end (which started from 5933.30), we need a sequential unfolding of specific retracement events. They are as below
1.      The breach below 6675 on 08th April 2014.
2.      The breach below 6660 on or before 11th April 2014.
3.      The breach below 6470 on or before 18th April 2014.

The faster the above events happen, the better for reversal. If the above events take place then we can expect 6200 till end of April 2014. The breach of 6470 on or before 18th April 2014 will also confirm that Nifty cash is going to move below 5930 on or before 6th June 2014.
Kindly note, the breach above 6778 will negate the expectation of fall.


WHAT EVER YOU EARN FROM MY CALLS PLEASE GIVE 10% PROFIT'S FOOD TO COWS AND DOGS HELP THM GOD WILL HELP YOU-!!!

Wednesday 2 April 2014

Buy MCX Copper April in the range of 401-402 for the target of 423 with a stop loss below 390. CMP 404

Buy MCX Copper April in the range of 401-402 for the target of 423 with a stop loss below 390. CMP 404
 
Reason: After heavy hammering of Copper prices have now gone into a consolidation mode. But prices have Reversed from Descending Channel support, forming Bullish Hammer pattern in Daily chart. Oscillators too have recovered and volumes are gradually increasing. 
 
 
Copper prices may get into buying frenzy above 408 and sustaining above this may push prices higher till 423 till end of this contract.


WHAT EVER YOU EARN FROM MY CALLS PLEASE GIVE 10% PROFIT'S FOOD TO COWS AND DOGS HELP THM GOD WILL HELP YOU-!!!