Monday 31 March 2014

RBI POLICY WILL GIVE THIS TSUFF MOMNT~~~!!!

BUY BANKNIFTY 12300 PUT @ 182
&
BUY BANKNIFTY 13400 CALL @ 185

CMP 12865 TOMORW RBI POLICY


WHAT EVER YOU EARN FROM MY CALLS PLEASE GIVE 10% PROFIT'S FOOD TO COWS AND DOGS HELP THM GOD WILL HELP YOU-!!!

Weekly roadmap for Nifty cash-31.03.2014 nitin sir

Well, the Nifty cash has crossed above our resistance off 6620. It has even crossed above 6650. In the previous report dated 8th March 2014, it was mentioned that if 6650 is crossed then the index may move towards 6840. So what next ?

The counts remains same but the time and price limits had changed due to extension in last wave.

Analysis : Anticipation for next 2-3 months.


Monthly wave chart updated till 28/03/2014


1.      The pattern anticipated from the end of wave circled c (red) is Diametric and currently, wave circled e (green) may be near conclusion.

2.      The anticipated wave circled e (green) seems to be unfolding as Diametric again and currently, wave (G) may be unfolding.

3.      The wave (G) is expected to conclude somewhere below 6760.

4.      If wave (G) concludes below 6760 then the Nifty cash may fall till minimum of 6200 before end of April 2014.

5. But if wave (G) crosses above 6760 then it has the capacity to extend till 7140 with in between resistance at 6875. In this case, due to extension, the expected fall may get late and may take place till end of June 2014.

Analysis : Anticipation for next 3-4 weeks.

Weekly wave chart updated till 28/03/2014


1.      The wave (G) may be very near to its conclusion and is expected to complete somewhere below 6725.

2.      If Nifty cash fails to move above 6725 and falls below 6470 during next week then it will indicate the completion of wave (G). In this case, the Nifty cash is expected to fall till minimum of 6200 before end of April 2014.

3.      But if Nifty cash crosses above 6725-6750 area then the monthly resistances at 6875 and 7140 will be required to be watched.

4.      If Nifty cash crosses above 6725-6750 area then wave (G) is extending and in this case, the expected fall may get delayed and 6200 may not be reached before end of April 2014.

Note : The clarity on daily chart is very low and hence is not presented in this report. But the cross below 6640 on or before 01/04/2014 will increase the probability of reversal. If 6640 is crossed on or before 01/04/2014 then we need to watch 6470.


Tuesday 25 March 2014

PAIR FOR APRIL MONTH

BUY APRIL MONTH 

6200 NIFTY PUT AT 17
BUY 7000 CALL @17

TOTAL PAID 34 HOLD TGT DBBL TRRPL

WHAT EVER YOU EARN FROM MY CALLS PLEASE GIVE 10% PROFIT'S FOOD TO COWS AND DOGS HELP THM GOD WILL HELP YOU-!!!

Tuesday 18 March 2014

Weekly roadmap for Nifty cash--NITIN SIR

Analysis : Anticipation for next 2-3 weeks. 

Weekly wave chart updated till 14/03/2014.


1. The pattern anticipated from the end of wave circled d is Diametric 

2. The last leg of anticipated Diametric is wave (G) and it may have been completed. 

3. The major resistance is at 6620 and the index is not expected to go above it 

4. The crucial support is at 6430 and its breach will confirm the completion of wave (G). 

5. The important weekly levels to watch on Nifty cash are 6620 and 6430. If index moves 
below 6430 then whatever top is formed below 6620 will be the major top which may not 
be visited during next 2-3 months. 

6. But if Nifty cash moves above 6620 then the count inside wave (G) will change. In this 
case, probably, there is missing wave (x) somewhere around 6375. Hence, wave (g) will 
end around 6375 and the move from 6375 to 6562.85 will be wave (a) of some corrective 
pattern. The next down move from 6562.85 to 6432.70 will be wave (b). Currently, the 
index may be in wave (c). The breach of 6620 may push index towards 6650

                                   Analysis : Anticipation for next week


Weekly wave chart updated till 14/03/2014 


1. The probability is high that wave (G) has completed.
 
2. If wave (G) is completed then Nifty cash should fall till minimum of 5950 on or before 
18th April 2014. 

3. The crucial levels to watch for next 2-3 days are 6430 and 6565. The breach below 6430 
may push index towards our target of 5950 whereas breach of 6565 may push it towards 
6620-6650 area. 

Conclusion 

1. The important levels to watch during next week are 6620 and 6430. 

2. The breach above 6620 may push index towards 6650 levels. 

3. The breach below 6430 will indicate that major top is in place. 

4. The completion of pattern (if 6620 is not crossed and 6430 is breached) will open Nifty cash for 
downward move that may reach till minimum of 5950. 

5. The minimum target of 5950 (if 6620 is not crossed and 6430 is breached during the week) may 
be reached before end of April 2014 (maximum time) with high probability of it reaching before 
18th April, 2014.

Other factors indicating that top may have been formed. 


The Nifty cash is at important Fibonacci resistance level where the last candle is “High wave” 
pattern which indicates reversal if its low is taken out. 


The USDINR has formed “Long legged Doji” on support created by confluence of 34 EMA and 
horizontal support line. The probability is high that the currency may move towards 63 levels.

Thursday 13 March 2014

CRUDE NIFTY HEDGE CALL~~~!!!

UPDATE 14.02.2014
NIFTY 6580 TO 6462=118*50=5900 PROFIT
CRUDE 5973 TO 6085=112*100=11200PROFIT

5900+11200=17100 NET PROFIT MORE TO COME 

UPDATE 13.02.2014
NIFTY 6580 TO 6503.15=3800
CRUDE 5973 TO 6038=65*100=6500

SO,
6500+3800=10300 IN JUST 4 HOURS WHAT ELSE YOU WANT????IN A DAY??

SAFE TRADER BOOK FULL PROFIT....REST HOLD WTH TSL...FOR MORE 10000 RS ONLY HAHHAHAA~~~!!!


SELL NIFTY FUT AT CMP 6580
BUY CRUDE OIL AT 5970-85

MINIMUM PTOFIT 10000 

Wednesday 12 March 2014

Update on Nifty cash(nitin sir)---A high probability short trade in the Nifty may be around the corner. Please go through update.

Hello everybody,

A high probability short trade in the Nifty may be around the corner. Please go through update.


Date : 11/03/2014 
Update on weekly roadmap for Nifty cash 

Daily wave chart updated till 11/03/2014


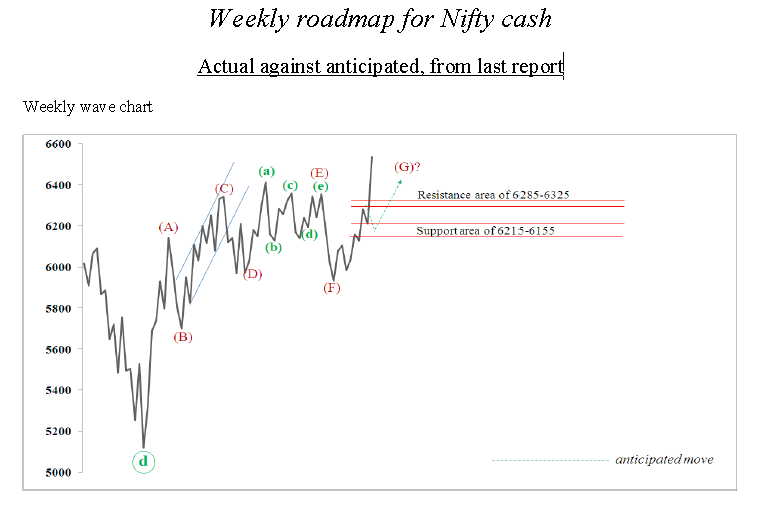
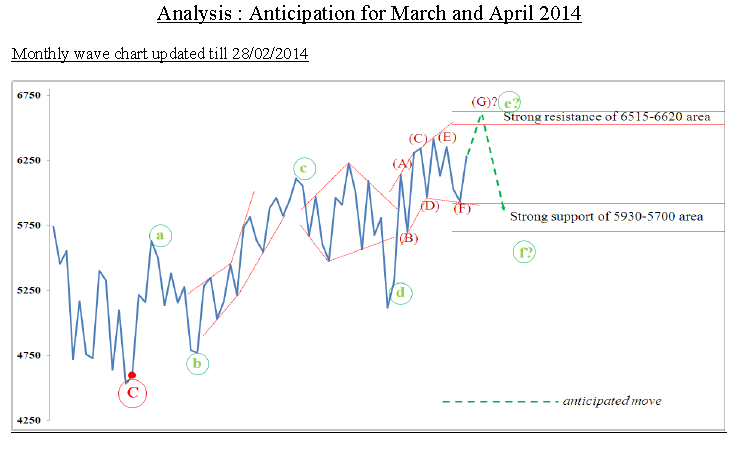
In weekly report dated 08/03/2014, it was mentioned that the Diametric which started 
from 5318.90 may end somewhere below 6620 (provided the wave (G) of anticipated 
Diametric is a standard corrective pattern). 
Kindly note, the NeoWave pattern becomes clear when it is very near to its completion. 

The wave (G) is probably very near to its completion. The wave (g) of (G) seems to be 
Complex correction ending with Contracting Triangle (with reverse alteration). 
If so is the case then Nifty cash should not move above 6570 in any case and the anticipated 
Contracting Triangle may end in 6531- 6555 area. 

The completion of wave (G) will open Nifty cash for down move which may reach till minimum of 5950 before 18th April 2014. 

Since the pattern completion is anticipation, therefore entering a short trade requires 


certain conditions to be fulfilled by Nifty cash and 
they are: 

1. The Nifty cash must move up till minimum of 6532. 

2. It should in no case move above 6570. 

3. After making top somewhere between 6532 and 6569, it should move down and cross below 6490. 

4. All the above things should take place on 12/03/2014. 

5. If all the above conditions are fulfilled then one can enter short on cross below 
6490 with stop loss above 6570 for target of 5950. The target may reach before 
end of 18th April 2014. 

6. The aggressive traders can enter short on cross above 6532 with stop loss above 
6570 for the same target. 

Monday 10 March 2014

Weekly roadmap for Nifty cash Date : 10/03/2014 (nitin sir)

Weekly roadmap for Nifty cash
Actual against anticipated, from last report

Weekly wave chart

Analysis : Anticipation for March and April 2014
Monthly wave chart updated till 28/02/2014


1.
Higher degree pattern anticipated from the end of wave circled C (in red) is Diametric. Currently, wave circled e (in green) is unfolding.
2.
The pattern anticipated inside wave circled e (in green) is again Diametric. Currently, wave (G) is progressing.
3.
The anticipated wave circled e is expected to conclude in the area of 6515-6620 before end of March 2014. A major top may form in the above mentioned resistance area. Kindly note, the decisive breach of 6620 may push index upwards towards next resistance of 6840 BUT that may take place in extreme case and will be due to some major event.
4.
The important level to watch during March 2014 is 6210 on Nifty cash which should not be breached on lower side if the index is to move towards 6620 resistance. The breach below 6210 before end of March 2014 will indicate the completion of wave (G).
5.
The completion of Diametric as wave circled g may open Nifty cash for down move and the expected minimum down move is till 5930 which may be reached before 30th April 2014. The probability is high of reaching 5930 level during March 2014 itself if the top of wave (G) gets confirmed during next five working days.
6.
The above mentioned expected down move may find support around 5700.

Analysis : Anticipation for next 2-3 weeks.
Weekly wave chart updated till 07/03/2014


1.
The pattern anticipated from the end of wave circled d is Diametric OR a complex correction with first part as Diametric.
2.
Till date, probably, wave (G) of anticipated Diametric is unfolding. The other probability is that wave (A) of some corrective pattern is going on after a missing X wave.
3.
The major resistance is at 6620 and the index is not expected to go above it IF only Diametric is unfolding. But if complex corrective with missing x wave is unfolding then index may move up till 6650 or 6840 depending on the variation of second pattern (first being Diametric).
4.
On lower side, 6415-6370 is the support area and breach of 6370 (without breaching above 6620) will negate the possibility of complex corrective (that is, possibility of crossing above 6620 will get negated).
5.
The important weekly levels to watch on Nifty cash are 6620 and 6370. The decisive breach above 6620 will increase the probability of index moving towards 6840 with in between resistance of 6650. Whereas, if index moves below 6370 (without moving above 6620) then whatever top is formed below 6620 will be the major top which may not be visited during next 2-3 months.

Analysis : Anticipation for next week.
Weekly wave chart updated till 07/03/2014


The clarity is very less on daily chart. More data will be required to bring clarity on chart.


Conclusion

1.
The important levels to watch during next week are 6620 and 6370.

2.
The breach above 6620 may push index towards 6840 levels.

3.
The breach below 6370 will indicate that major top is in place.

4.
The completion of pattern (if 6620 is not crossed and 6370 is breached) will open Nifty cash for downward move that may reach till minimum of 5930.

5.
The minimum target of 5930 (if 6620 is not crossed and 6370 is breached during the week) may be reached before end of April 2014 (maximum time) with high probability of it reaching before end of March 2014 (if top is formed in next week below 6620).

Nifty (6526.65, +125.50, +1.96%)

The rise is uncomfortably vertical and we are expecting a correction in the day’s session even if it were to open higher and post a higher high compared to the last Friday’s all-time high of 6537.80. This kind of large price swing in the Nifty has happened twice (Sep 19 and Oct 18 last year) in the last six months and they led to a short term reversal on both occasions. Current upswing has already overstretched stock prices quite a bit and on top of that this last day’s gain of 125+ points clearly point to an impending correction—either a short downswing or a sideways consolidation. However, so long as the zone between 6446 and 6385 does not broken on high volume bulls would again try to pull things up to test the index high again.

 Most critical level: 6492, its first support as well
Strong support: 6446 – 6385
Major support: 6362 – 6343
Strong resistance: 6538 – 6549
Major resistance: 6579 – 6604

 Bank Nifty (11884.75, +606.40, +5.38%)

Even this huge performer is also well set for a corrective downswing. These huge vertical rallies generally happen just prior to a correction. However, unless you see the range between 11500 and 11300 getting violated on heavy selling the current upside momentum is unlikely to cause any serious concern. On the way up, it needs to clear the important supply zone between 12203 and 12246 no sustained rally is probable. In case, it goes down it is likely to take support at 10933 through 10860 range. So long as this range is not taken out, we can expect the bulls to stage a comeback again since neither the Nifty nor the Bank Nifty has risen so far on negative divergence.

Most critical levels: 11760 – 11685
Strong Support: 11500 – 11300
Major support: 10933 – 10762
Strong resistance: 12203 – 12246
Major resistance: 12538

Friday 7 March 2014

PAIR STRETEGY FOR MARCH~~~!!!

BUY BANKNIFTY 11300 PUT AT 95
BUY BANKNIFTY 12500 CALL AT 94

&

BUY NIFTY 6650 CALL @45
BUY NIFTY 6400 PUT @41

HOLD TILL EXPIRYY MONEY U LL GET DBBL~~~!!!!!


WHAT EVER YOU EARN FROM MY CALLS PLEASE GIVE 10% PROFIT'S FOOD TO COWS AND DOGS HELP THM GOD WILL HELP YOU-!!!

ITS JUST A VIEW OF SOME CALCULATIONS...JUST READ IT FOLLOW AS PER UR RISK...AND UR VIEW......!!!

Dear all,

FYI…. No recommendation. Only as information….

NIFTY WEEKLY CHART

Source Telequote

HISTORY REPEATS IT SELF  As we have witnessed  the Pre - election breakout has just started today, with a Triple Top Breakout can also be seen on the NIFTY weekly chart.


This time the Breakout is exactly 8 weeks before the result and the 9

th  week is the judgment day  (Result 16 May)

And in the 12

th  week we could witness the immediate top.


The pre-election breakout thrust was till 3700 that’s approx. 15 % rally from breakout from 3200

So if we calculate breakout from 6356 the rally comes to 7309 that is (15% of 6356=953) 6356+953=7309

And after the result the market gave a GAP UP rally and went up to 4692.

If we calculate total rally 4692 – 3200 = 1492 that’s almost  46% rally from the breakout

So if we calculate breakout from 6356 the rally comes to 9279 that is (46% of 6356 = 2923) 6356+2923=9279.

But conservatively we take T1 of 7400  , T2 7817 (50% rally) and T3 8168 (61.8% Fibonacci level) and 9279 (100% Fibonacci level ).


Strategy =  Go Long on NIFTYT till 6200 (CMP 6500) , SL 6000 TGT 7300-7800 (1-3 Months)

  • Nifty (6401.15, +72.50, +1.15%)
  •  Momentum continues! For the first time in its history, the Nifty has closed above the 6400-mark. Chances are today we would see a new all-time high. While the Nifty may show higher high there are certain things we ought to keep in mind without being euphoric. They are (i) the 6300, 6300 and 6400 strike Nifty March put options have added a huge 4 million units in open interest (OI)—this constitutes roughly 40% of the total OI for these contracts. This displays a sign of over confidence amongst the bulls. Even 2/3rds of the total OI tally of the 6500 March Nifty put options have been added today and it closed at a premium of just 110.90. This sum of 5 million freshly added put options could face real trouble if, for any reason, profit taking sets in.
  • Most critical levels: 11252 and 11176, its immediate support zone as well Strong resistance: 11317 – 11396 Next strong resistance: 11414 – 11468 Major resistance: 11552 – 11717 Strong support 11110 – 10091 Major support: 10923 - 10774 
  • Bank Nifty (11278.35, +179.55, +1.618%)

    It has shown real splendor even on the last session and crossed the critically important zone between 11176 and 11252. Now, unless it falls and stays below 11198-level we need not have any serious concern for the Bank Nifty. On the way up, the zone between 11414 and 11468 would be another potential supply zone the bank bulls would have to take care of. On the downside, the intermediate uptrend does not face any threat of getting ruptured till such the bank bulls can defend the 10920-support area.

  • Most critical levels: 11252 and 11176, its immediate support zone as well
    Strong resistance: 11317 – 11396
    Next strong resistance: 11414 – 11468
    Major resistance: 11552 – 11717
    Strong support 11110 – 10091
    Major support: 10923 - 10774

  • Thursday 6 March 2014

    Wednesday 5 March 2014

  • Nifty (6297.95, +76.50, +1.23%) International scenario turned better with things improving on the Russian front. The Nifty got over its initial weakness early on in the last session and crossed the most critical zone between 6215 and 6230 and it did not look back after that. Now, it needs to cross 6310 decisively to move up even further from here. And, in any profit taking, it should not fall below its important support zone between 6265 and 6244 to retain its strength; however, so long as it does not close below 6187 today, the uptrend would not be under threat. On the way up, the levels between 6338 and 6370 could act as another significant supply zone: only when it is firmly taken out we can expect a retest of the all-time high of 6415

  • Most critical levels: 6291 – 6312, its immediate resistance Strong resistance: 6338 – 6370 Major resistance: 6398 – 6415 Strong support: 6265 – 6244 Major support: 6215 – 6187


  • Bank Nifty (10929.05, +277.10, +2.60%) Finally, a close above both the 200-day MAs—simple and exponential—at one shot! This momentum now has to be sustained in order for this upswing to morph into a real intermediate uptrend. And that will be confirmed when the index takes out the next major resistance between 11175 and 11250 levels. However, prior to that the range between 11003 and 11047 might also act as a hurdle that could trigger another round of correction and/or consolidation. Now, in case, there is any selling again so long as it does not fall and close below 10772 and 10755 in the day’s session, the uptrend remains intact any minor dips notwithstanding. . Most critical levels: 10887 – 10920, its immediate support as well Strong support: 10772 – 10755 Major support: 1069 
  • Tuesday 4 March 2014

    Nifty (6221.45, -55.50, -0.88%)

    The index opened lower and posted a lower high compared to last Friday’s session and closed nearly 1% down after its derivatives added 7.77% in fresh open interest addition. The hourly chart also looks quite negative. The bulls have almost lost their advantageous position—unless the cues from international markets are rank positive, the Nifty is likely to head down below the 6200-mark. It needs to quickly regain ground and stay above the immediate resistance zone between 6215 and 6230 if it were to show any sign of recovery. If the bulls fail to push the Nifty higher, the index could well slide further to go and test the strong support area between 6169 and 6154. However, the intermediate uptrend in the index remains intact till such time it stays above 6127 – 6085-levels.

    Most critical levels: 6215 – 6230, its immediate resistance zone as well
    Strong support: 6169 – 6154
    Major support: 6127 – 6085
    Strong resistance: 6243 – 6259
    Major resistance: 6277 – 6310


    Bank Nifty (10651.95, -112.75, -1.05%)
    As usual, the bank index have suffered much more than the Nifty—it has lost more than 1% of its value over last Friday’s session and its derivative contracts have added more than 13% in open interest. This indicates fresh bearish pressure might well build up unless the index holds itself above the 10560-mark in the day’s session. Falling below the above level and staying there with increased volume activity would indicate more weakness developing and further prospect of lower levels being retested. On the other hand, if there were to be a recovery then we need to see 10669 – 10688 range being taken out decisively. If the bulls manage to push the Bank Nifty above this range and hold it then we are likely to see fresh buying coming back again.

     Only on a close above 10770—we would find real bullish strength again.
    Most critical levels: 10669 – 10688, its immediate resistance as well
    Strong resistance levels: 10770 – 10805
    Major resistance: 10895 – 10920
    Immediate support: 10635 – 10610
    Strong support: 10570 – 10535
    Major support: 10430 - 10325

    Monday 3 March 2014

     Nifty (6276.95, +38.15, +0.61%)

    Technically, the index is looking quite bullish despite being very close to its major resistance zone just above the 6300-mark. We tend to think that once it manages to take out 6290 – 6310 supply zone it would be able to scale up even further to levels close to the 6350-mark or even higher. Chances are, we would see some more momentum coming especially when even long battered sectors like infrastructure sector stocks are also attracting buyers in the recent past. Barring the metals most indices are buoyant in varying degrees. Today is the first day of March—the history of index performances in this month since 2009 is rather mixed giving no real clue as to how the whole month would pan out. However, as of now, we start the month with 'Advantage Bulls.


     Bank Nifty (10764.30, +34.30, +0.32%)

    We still believe that the prospect of a test of the eventual target of the 10920-level in this current upswing in the Bank Nifty would be met in this month; however, there is a sign that the index movement suggests a bit of tiredness while leading momentum stocks like the Axis Bank continues to cruise upwards. In any case, with some help from its leading constituents it might still make it this month. Immediately, the all-important levels of 10770 through 10777 need to be taken out decisively and only then we can expect a dash at 10910 – 10920 being scaled.

    Most critical levels for the day: 10770 – 10777, its immediate resistance
    Strong resistance: 10827 – 10843
    Major resistance: 10911 – 10920, in case it moves beyond then 11014 - 11047
    Immediate support: 10723 – 10676
    Strong support: 10625 - 10557
    Major support: 10496 – 10431

    WHAT EVER YOU EARN FROM MY CALLS PLEASE GIVE 10% PROFIT'S FOOD TO COWS AND DOGS HELP THM GOD WILL HELP YOU-!!!